Weekly: A Test of Resiliency
Market participants eyed January's CPI report in hopes of a bearish inflection point
STRATEGY: The market has passed its first test of inflationary data. While CPI came in higher than the previous print, “one point does not a trend make.” Continue buying bitcoin and ether pullbacks with an eye on the 200-day moving average for support. This strategy is supported by:
Continued lack of meaningful contagion within crypto, particularly in the “forced selling” realm
Price resilience following an uptick in Fed Fund expectations as well as four-month highs in yields across the curve. Digital assets and equities have found n/t support at $21,600 (bitcoin), $1,500 (ether), and 4100 (SPX)
A more resilient than expected US economy, with continued disinflation, a robust labor market, and decent equity earnings as a “good enough” foundation for risk assets after a tough year
A continued equity rally in which increases the relative value of crypto off its highs
The systematic signal of price > 200D moving average
Risks to this strategy include:
A further uptick in Fed Fund expectations (5.5% - 6%)
Surprising crypto contagion news leading to forced selling.
2/15/2023 Strategy Note
A Test of Resiliency
Well, there we have it. The highly anticipated CPI report for the month of January came in at 0.5% headline and 0.4% core, in line with estimates, but an outlier when compared to previous prints.
Of course, after six months of disinflationary data, a hot nonfarm payrolls report on Friday the 3rd led to some participants’ renewed concerns that inflation is stickier than prior data suggests.
While Fed Fund futures markets have remained rangebound since mid-October, these first few weeks of February have led to an uptick in expectations for Fed policy throughout this year:
Since October, markets believed a peak 5% Fed Funds rate will occur between March and May of 2023.
Now, markets expect a 5.25% peak in July, with a 67% chance of 5.5%
Previously, markets expected two cuts by the end of the year.
Now, markets expect a 5.25% rate through December.
So yes: recent inflationary data now has the bond market pricing in a hawkish tilt from the Federal Reserve to the tune of at least one more hike. Therefore:
Noise: “Sticky inflation data and higher Fed Funds are not priced into markets”
Signal: See above.
So, with renewed expectations of Fed tightening and higher yields, why didn’t equities or digital assets respond negatively, like they did last year?
Well, “one point does not a trend make.” While headline inflation has ticked up (0.5% m/m vs. revised 0.1% prior), core inflation has remained the same (0.4% vs. revised 0.4% prior).
In fact, when assessing the 3-month annualized rate of inflation (a better gauge than the y/y number), the Fed’s work has been successful thus far. This one data point hasn’t changed the disinflationary trend seen in recent months, and as a result, wasn’t worthy of a selloff like those experienced following the “hot prints” of 2022.
Even with this number, the 3-month annualized pace of headline CPI stands at 3.2%, while the annualized pace of core stands at 4.5%. Note this is much better than the surface level y/y numbers suggest.
Further, the significant and unusual “Fed uncertainty” that roiled markets in 2022 is much behind us, playing a part in the risk asset rally that began in Q4.
While the peak Fed Funds Rate is still up in the air, there is some level of assurance that the end is near. Currently, the Fed Funds Rate is 4.75%, meaning the Federal Reserve is at least 85% complete in its tightening cycle.
Consider this stark contrast to July of 2022, when the Fed Funds Rate was 1.75% and was expected to more than double (to 3.75%) by March of 2023. At that time, there was a lot of tightening ahead, creating more uncertainty over economic growth than there is today.
Because now, even with 450bps of tightening in just one year, the economy remains strong. Still, there have been zero cracks in the labor market (3.4% unemployment rate), and corporate earnings have declined just -2.6% y/y in Q4 (S&P 500 Index).
Those that are in the hard-landing camp have some explaining to do. Remember, the US remains in expansionary mode:
Final Q3 GDP = 3.2%
Advance Q4 GDP = 2.9%
Estimate Q1 GDPnow = 2.4%
So, while yields have moved higher, this time around, digital assets and equities “fear-not.”
This signals that the group is well positioned to rally should the recent increase in yields be a false breakout and the group’s “last stand.”
At the time of writing, bitcoin has turned its pre-FTX November highs into February support, illustrated below:
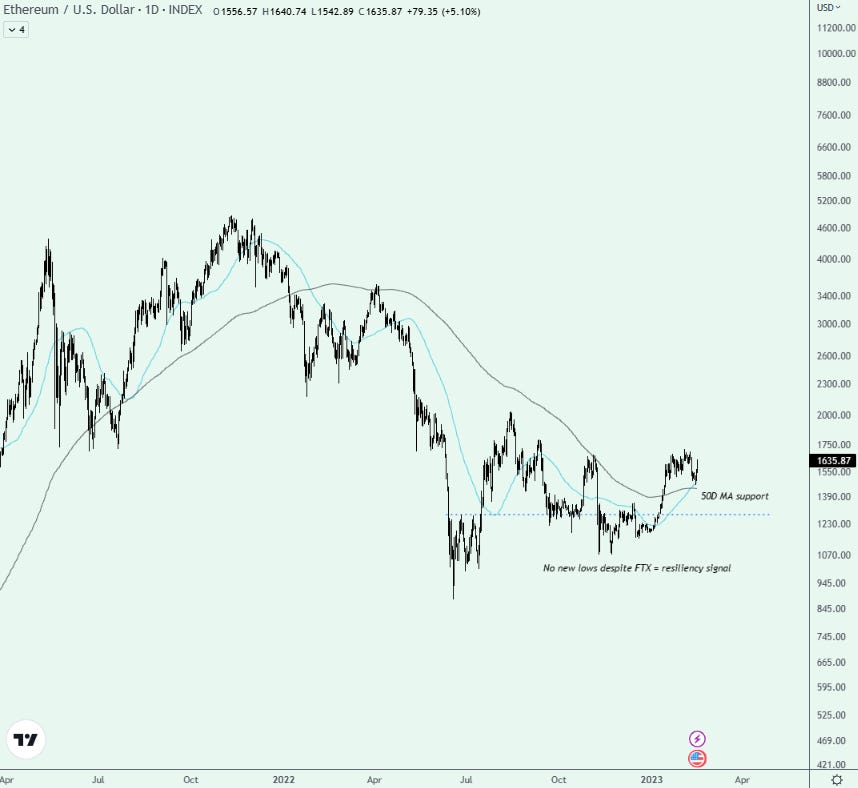
And ether utilized its 50D moving average as support, as well:
Note that even idiosyncratic crypto risk in the week was unable to push prices lower for too long. The settlement between the SEC and Kraken for the centralized exchange’s “staking-as-a-service” created a knee-jerk reaction lower, but selling pressure abated. Here, the SEC believes that STaaS (staking-as-a-service) is an unregistered security, which is likely the case (an investment contract.)
Importantly, “staking” is different than “staking-as-a-service” and the recent move by the SEC focused on the lack of transparency offered by centralized exchanges.
The SEC also sued Paxos, the issuer of BUSD, alleging the asset is also an unregistered security.
Consider this post-FTX regulation as the growing pains experienced with cleaning up the last of the wild west in digital assets.
Despite this week’s events, my strategy remains the same:
STRATEGY: The market has passed its first test of inflationary data. While CPI came in higher than the previous print, “one point does not a trend make.” Continue buying bitcoin and ether pullbacks with an eye on the 200-day moving average for support.
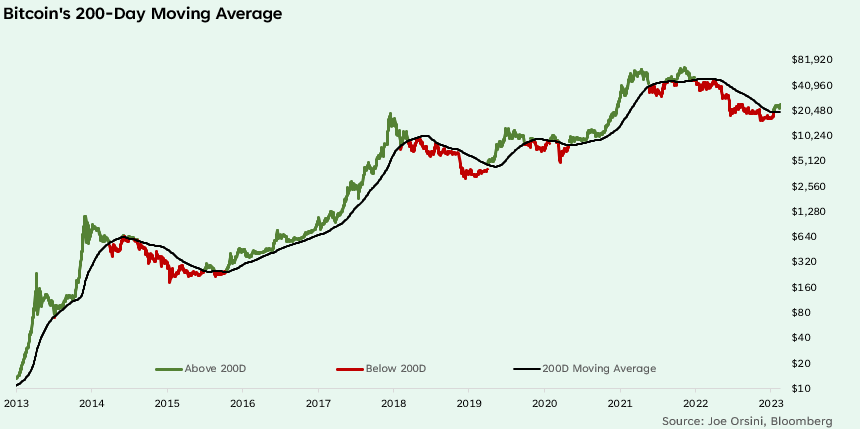
For illustration, I color code the chart for when bitcoin’s price is above the 200-day moving average (green) and below (red). This simple indicator is a clear and simple “signal” for those looking to identify the longer-term trend.
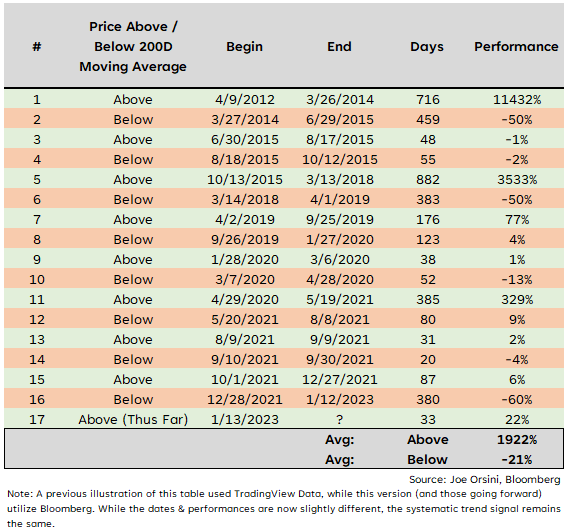
We can identify 17 occurrences when bitcoin’s price flipped above or below the 200D moving average, illustrating a robust signal for long-term trend following.
Stay Tuned,
Joe Orsini, CFA, CMT


