


Weekly: What A Difference A Month Makes
Risk assets and crypto rally "against all odds" to start the 2023 year


STRATEGY: Improving macro conditions coupled with bitcoin’s rally above the key 200-day moving average indicates a high likelihood of a positive "trend-change" - while gains are somewhat extended, bigger pullbacks should be bought with an eye on the 200-day moving average for support. This strategy is supported by:
Continued lack of meaningful contagion within crypto, particularly in the “forced selling” realm
Alleviation of last year’s macro-overhangs, with yields and the dollar having reversed trend since Q4 ‘22 (as the Fed nears the end of their hiking cycle)
A more resilient than expected US economy, with continued disinflation, a robust labor market, and decent equity earnings as a foundation of support for risk assets
A continued equity rally which increases the relative value of crypto off of its highs
The continued improvements in sentiment as the market moves away from the idiosyncratic crypto risks in Q2 and Q4 2022
Risks to this strategy include:
A continuation of hotter-than-expected economic data that results in higher yields, higher Fed Fund expectations (i.e, a 5.5% peak rate expectations), and a reversal in the dollar
Surprising crypto contagion news leading to forced selling
This initial note is designed to frame my past and present views on the market environment for a greater context of what’s to come. Going forward, there will be less explanation of the past.
2/9/2023 Strategy Note
What a difference a month makes!
By the end of 2022 - most market participants felt hopeless. After all, it was a tough year for nearly all assets, not just the speculative bitcoin and ether, but equities and even fixed income.
Recency bias - or the belief that what’s occurred in the past will continue in the future - left many believing that 2023 would be even worse than 2022.
These calls occurred even after the Nasdaq’s and S&P 500’s -36.4% and -25.4% peak-to-trough decline and even despite the continued signs of disinflation that occurred throughout the year. (I wrote extensively about breakeven rates, commodities, and surveys as signs that inflation peaked in June).
Throughout much of the second half of the year, many participants believed low prices and the continued rollovers in equities & crypto were signs of more DANGER than OPPORTUNITY and remained hesitant to “buy the dip” because “Don’t Fight the Fed.”
But just as both bulls and bears became complacent, a relentless rally occurred “against all odds.”
Equities bottomed with the October 13th “failed breakdown” after hotter-than-expected inflation. (Bottom on bad news? Check.) This equity bottom occurred nearly simultaneously with the reversal in both global yields and the dollar, as the two macro-overhangs began to alleviate their pressure on risk assets.
And while digital assets participated at the beginning of that rally, they were quickly “slapped in the face” by the FTX news that began on November 2nd.
After a sharp decline and a ~$15,700 bottom by bitcoin on November 9th, price action then consolidated. With this black eye, many called for a deeper crypto winter and even forecasted prices below $12,000.
But I remained positive. After all, bitcoin continued to trade below its realized price (the average price of all on-chain holders, an “on-chain cost basis”), and despite multiple idiosyncratic risk events (i.e. Luna/3AC/Voyager/Blackfi/Celsius in May/July, FTX in November) held up quite well in the face of macro uncertainty.
And just as the FTX events unfolded, so did a key macro inflection point:


And so, the tradeoff then became the macro improvements (2 steps forward) versus the negatives of FTX (believed to be 10 steps back).
Market participants soon found out that macro is much bigger than FTX.
With improving conditions and an equity rally, digital assets were eventually going to follow, it was only a matter of time:
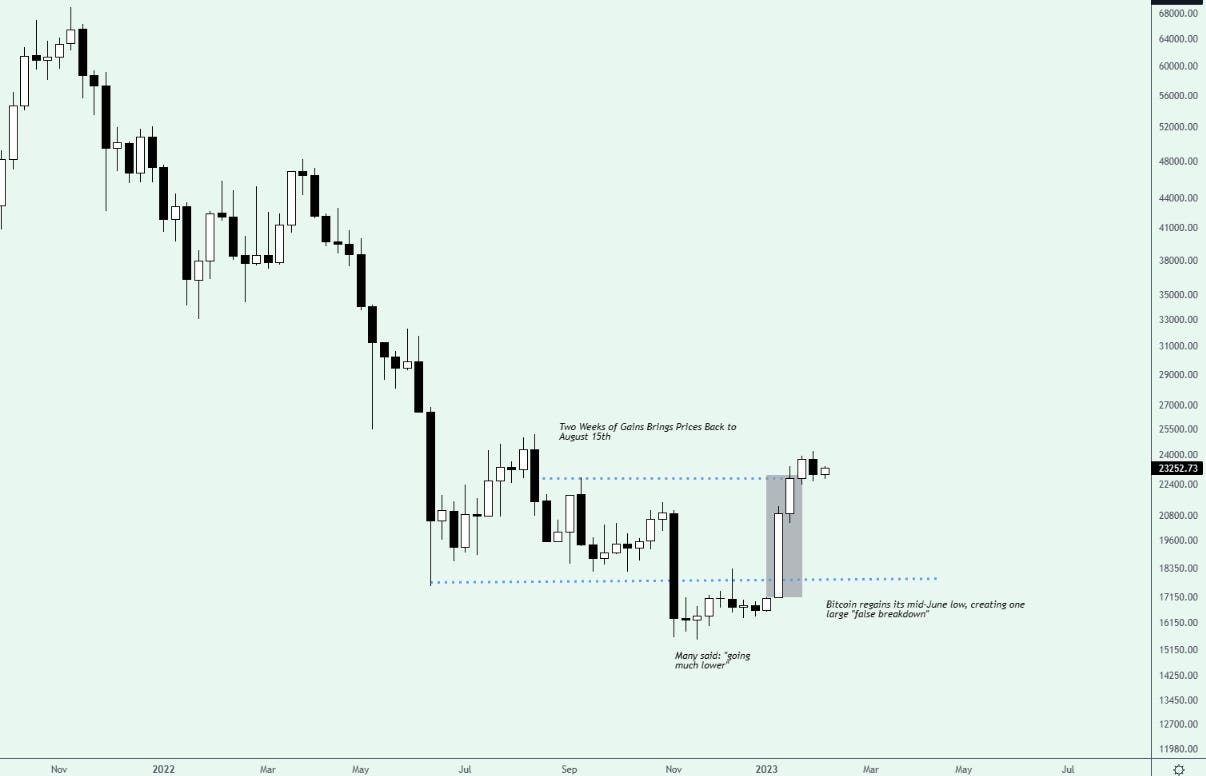
And quickly, five months of losses were erased in just two weeks. Bitcoin rallied from ~$17,000 to $22,800 in a short fashion, bringing prices back to those seen in mid-August. The regaining of the June low (~$17,600) confirmed that the FTX event was one big “false breakdown”.
Since then, prices have consolidated.
Okay, so enough with the past, let’s talk about the future.
So, where do we go from here?
Well, at the time of writing, bitcoin is trading around $23,200, after posting a 40% gain in January.
The key focus of global markets for now (of course, alongside the usual inflation, the Fed, and a soft/hard landing) is the most recent non-farm payrolls report that came in well above expectations.
The concern of some is that this one data point, despite the continued disinflation illustrated through CPI, PCE, PPI, and many surveys, will lead Jerome Powell towards a renewed hawkish tilt, contrary to recent dovish indications.
Fed Fund Futures have ticked higher, with the key May contract (the meeting after March) now back to 5.0% (which gives some probability of a 5.25% peak). More importantly, December 2023 and December 2024 implied policy rates have ticked up as well, indicating that the “cuts” originally priced in for later this year and next are now slightly less likely than before the NFP report.
So, while bond markets have responded for the time being, crypto markets have remained resilient.
More importantly, is that longer-term trend signals such as the price crossing the 200-day moving average flipped bullish on January 12th (see below).
Perhaps this is the beginning of a new bull market.
STRATEGY: Improving macro conditions coupled with bitcoin’s rally above the key 200-day moving average indicates a high likelihood of a positive "trend-change" - while gains are somewhat extended, bigger pullbacks should be bought with an eye on the 200-day moving average for support.
For illustration, I color code the chart for when bitcoin’s price is above the 200-day moving average (green) and below (red). This simple indicator is a clear and simple “signal” for those looking to identify the longer-term trend.

We can identify 17 occurrences when bitcoin’s price flipped above or below the 200D moving average, illustrating a robust signal for long-term trend following.

Perhaps this is the beginning of a new bull market.
Stay Tuned,
Joe Orsini, CFA, CMT